Explorance Blog
Keep up to date with the latest information, tips and tactics about feedback analytics and insights
Featured Articles

Convince Your Manager to Attend Explorance World 2026: Step-by-step Guide and Free Template
Download a justification letter template and get role-specific talking points to secure manager approval for Explorance World 2026 in Boston.
6 min read

Faster, Smarter, More Accessible Feedback Analytics with Explorance Blue 9.6
Explore the latest Blue 9.6 update, featuring faster report generation, full accessibility compliance, improved project management, and enhanced AI-powered feedback analysis
3 min read
Employee Engagement Strategies That Drive Measurable Results in 2026
HR leaders use these employee engagement strategies to reduce turnover, increase productivity, and build feedback loops that produce measurable results across teams.
16 min read
Latest Articles
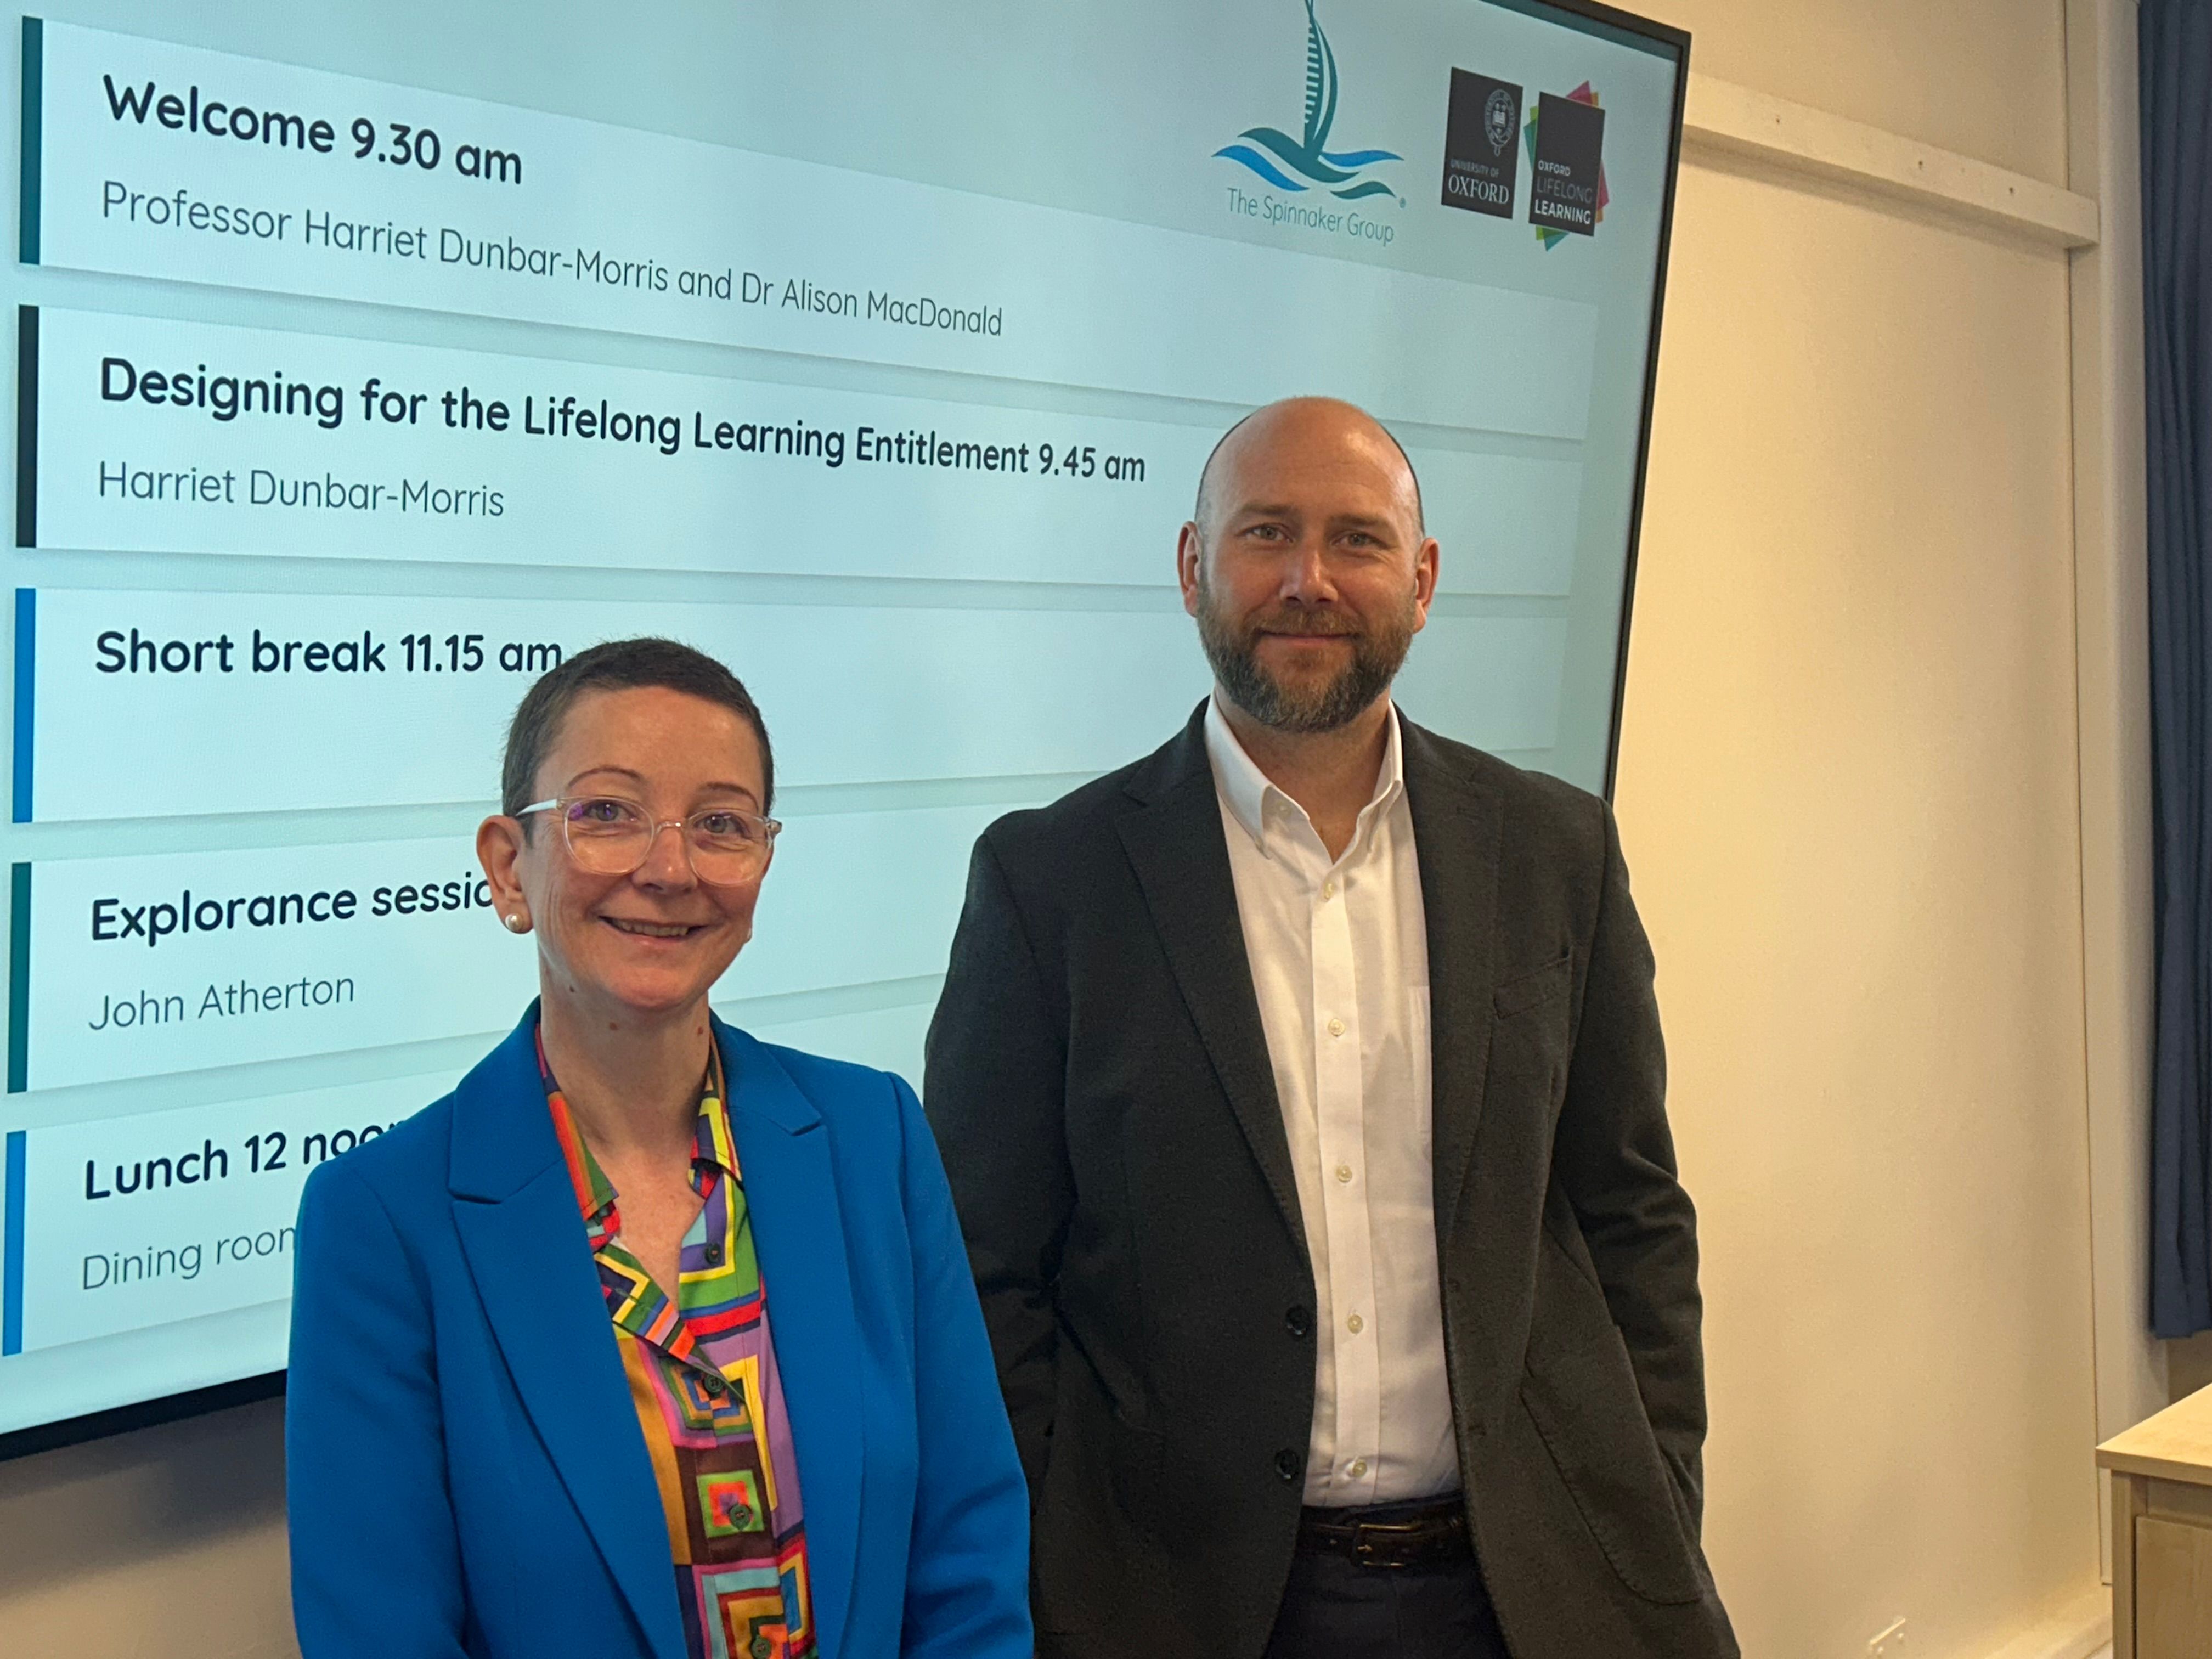
Redesigning Higher Education for Lifelong Learners: 5 Takeaways from Spinnaker Group
Get Spinnaker Group's 5 takeaways on boosting student engagement, reduce loneliness, and break assumptions with innovative strategies.
8 min read
5 Key Benefits of Organizational Development
Organizational Development can enhance various aspects of the organization, such as its structure, culture, processes, and people.
6 min read
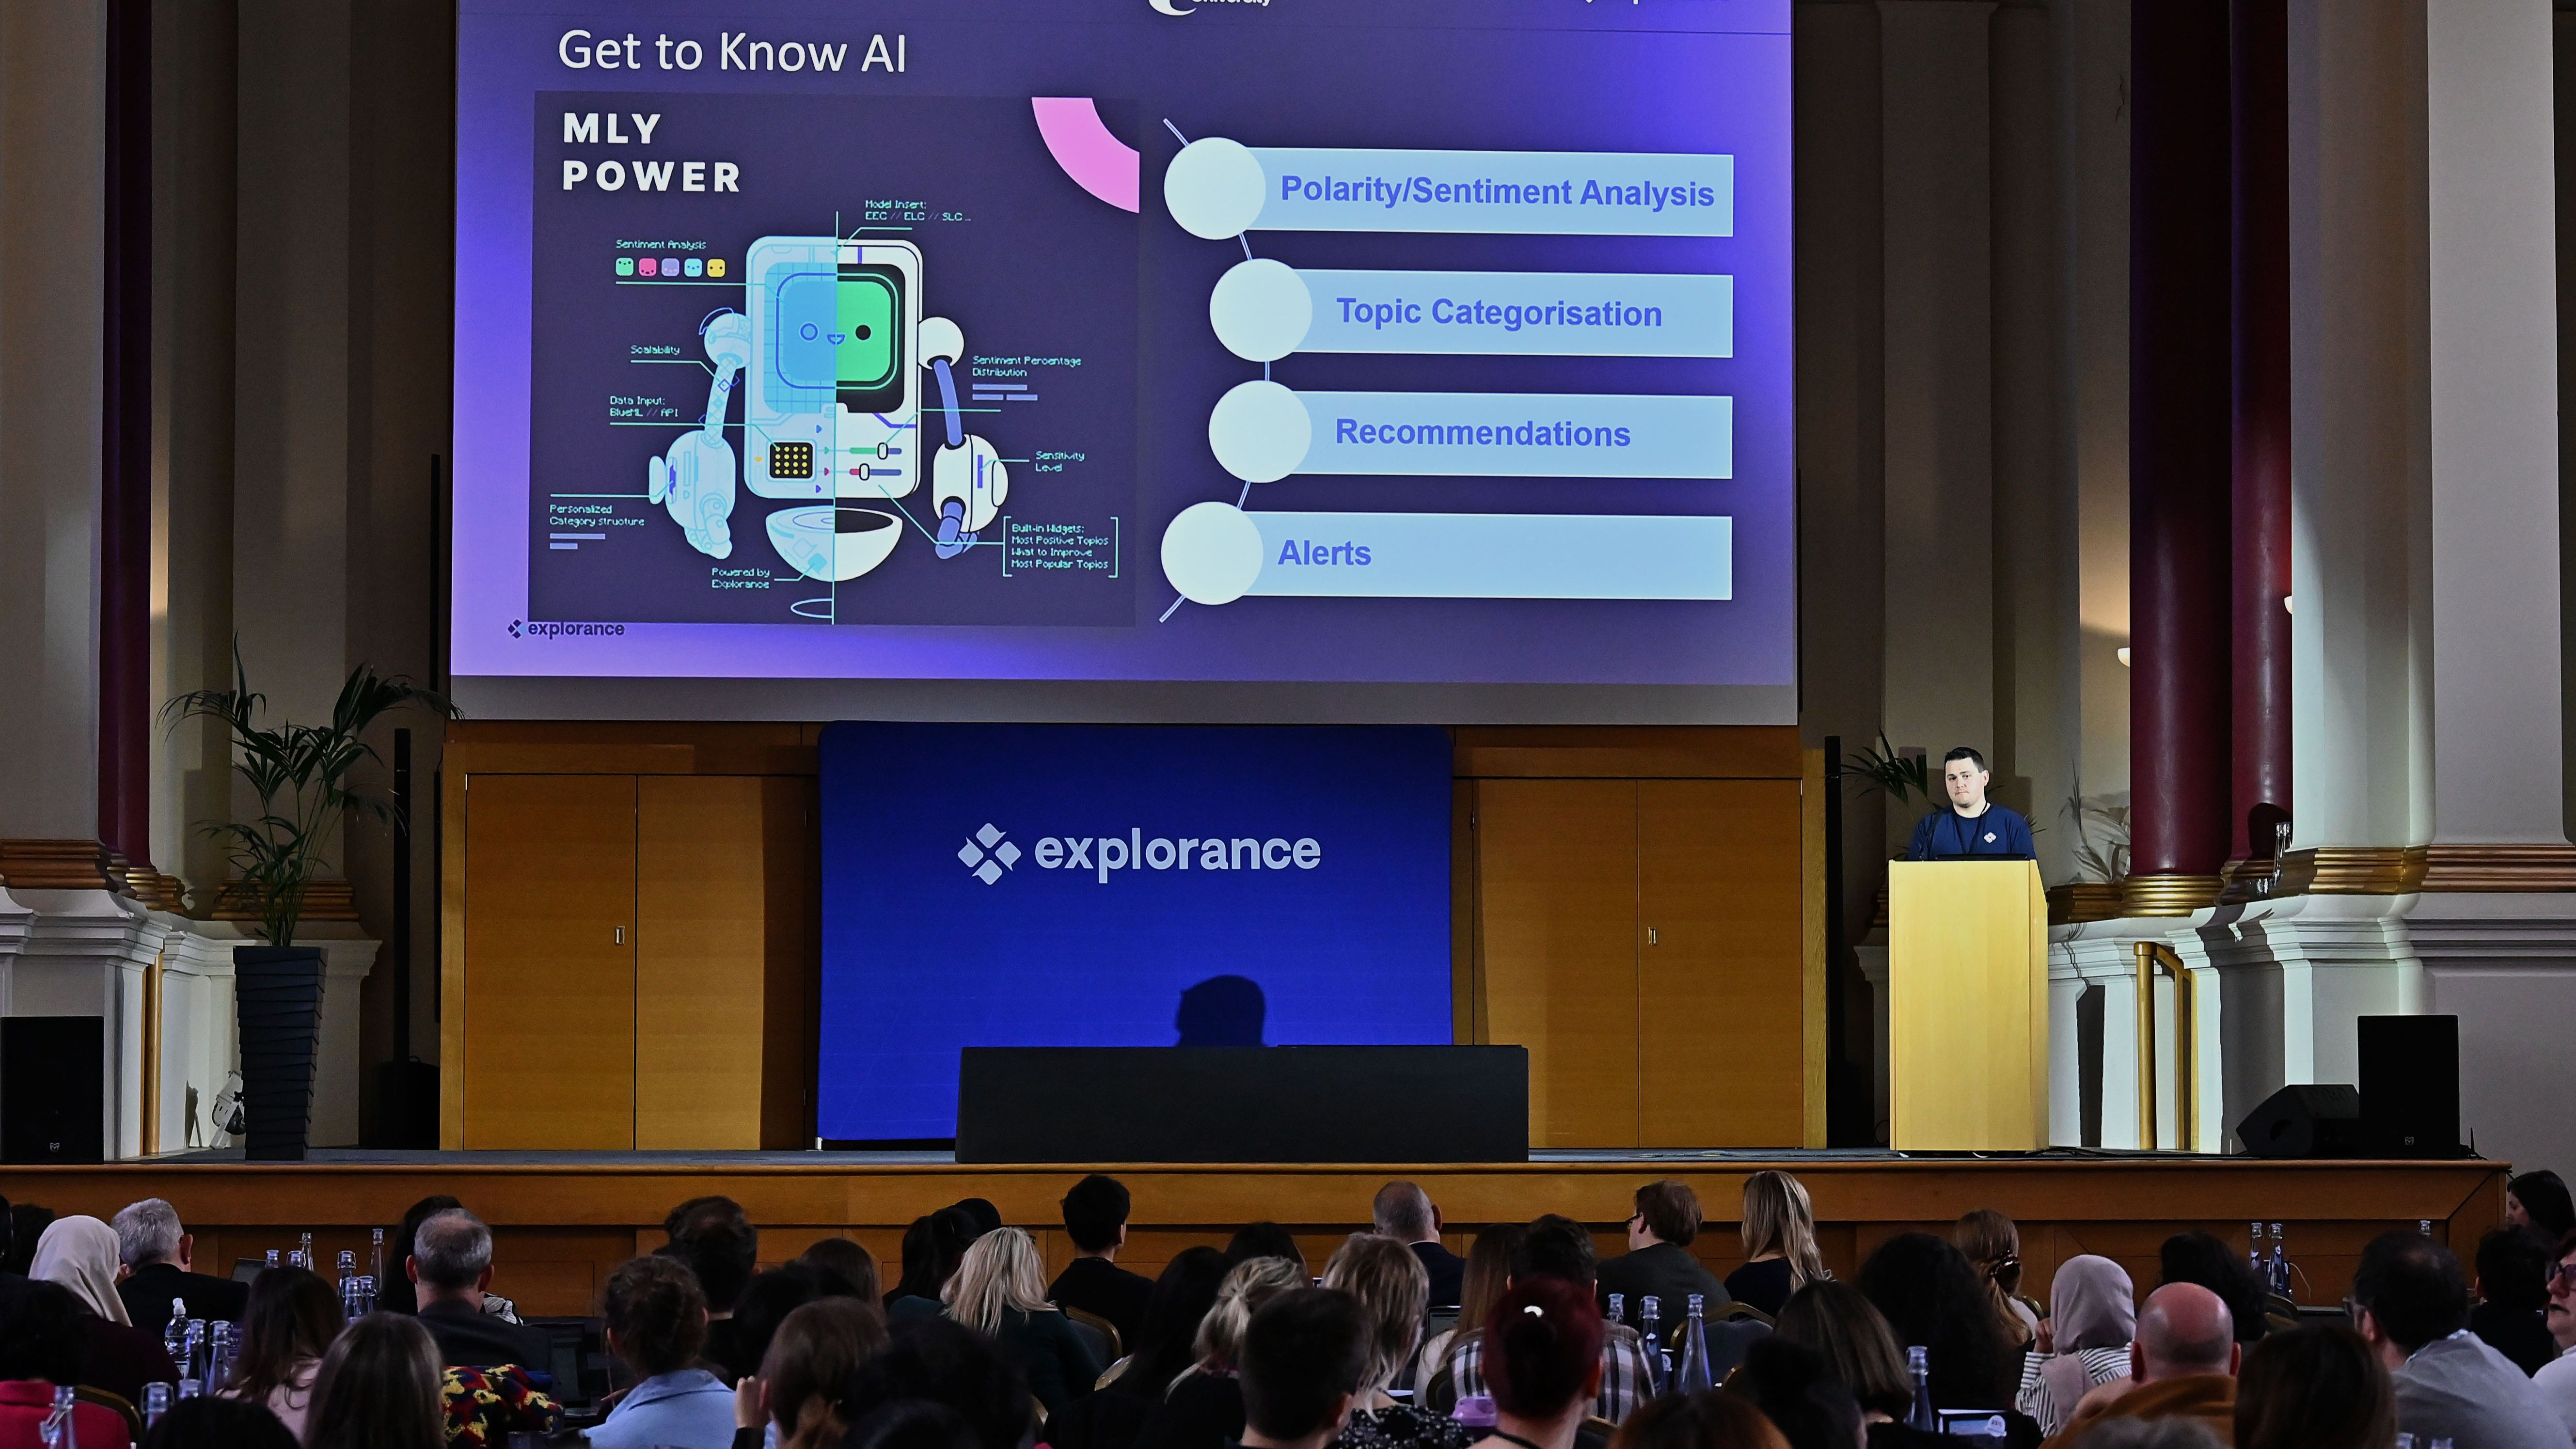
MLY 3.3 Release: Deeper Insights, Shared Intelligence, and Inclusive Access
Discover MLY 3.3, enhancing qualitative feedback analysis with dynamic filters, global custom analysis, WCAG 2.2 AA accessibility, and improved performance for scalable, inclusive insights.
4 min read

Reimagining Student Voice: From Historical Structures to Continuous Dialogue
Legacy feedback structures limit what universities actually hear. Explore how continuous dialogue and analytics can make student voice more meaningful.
7 min read
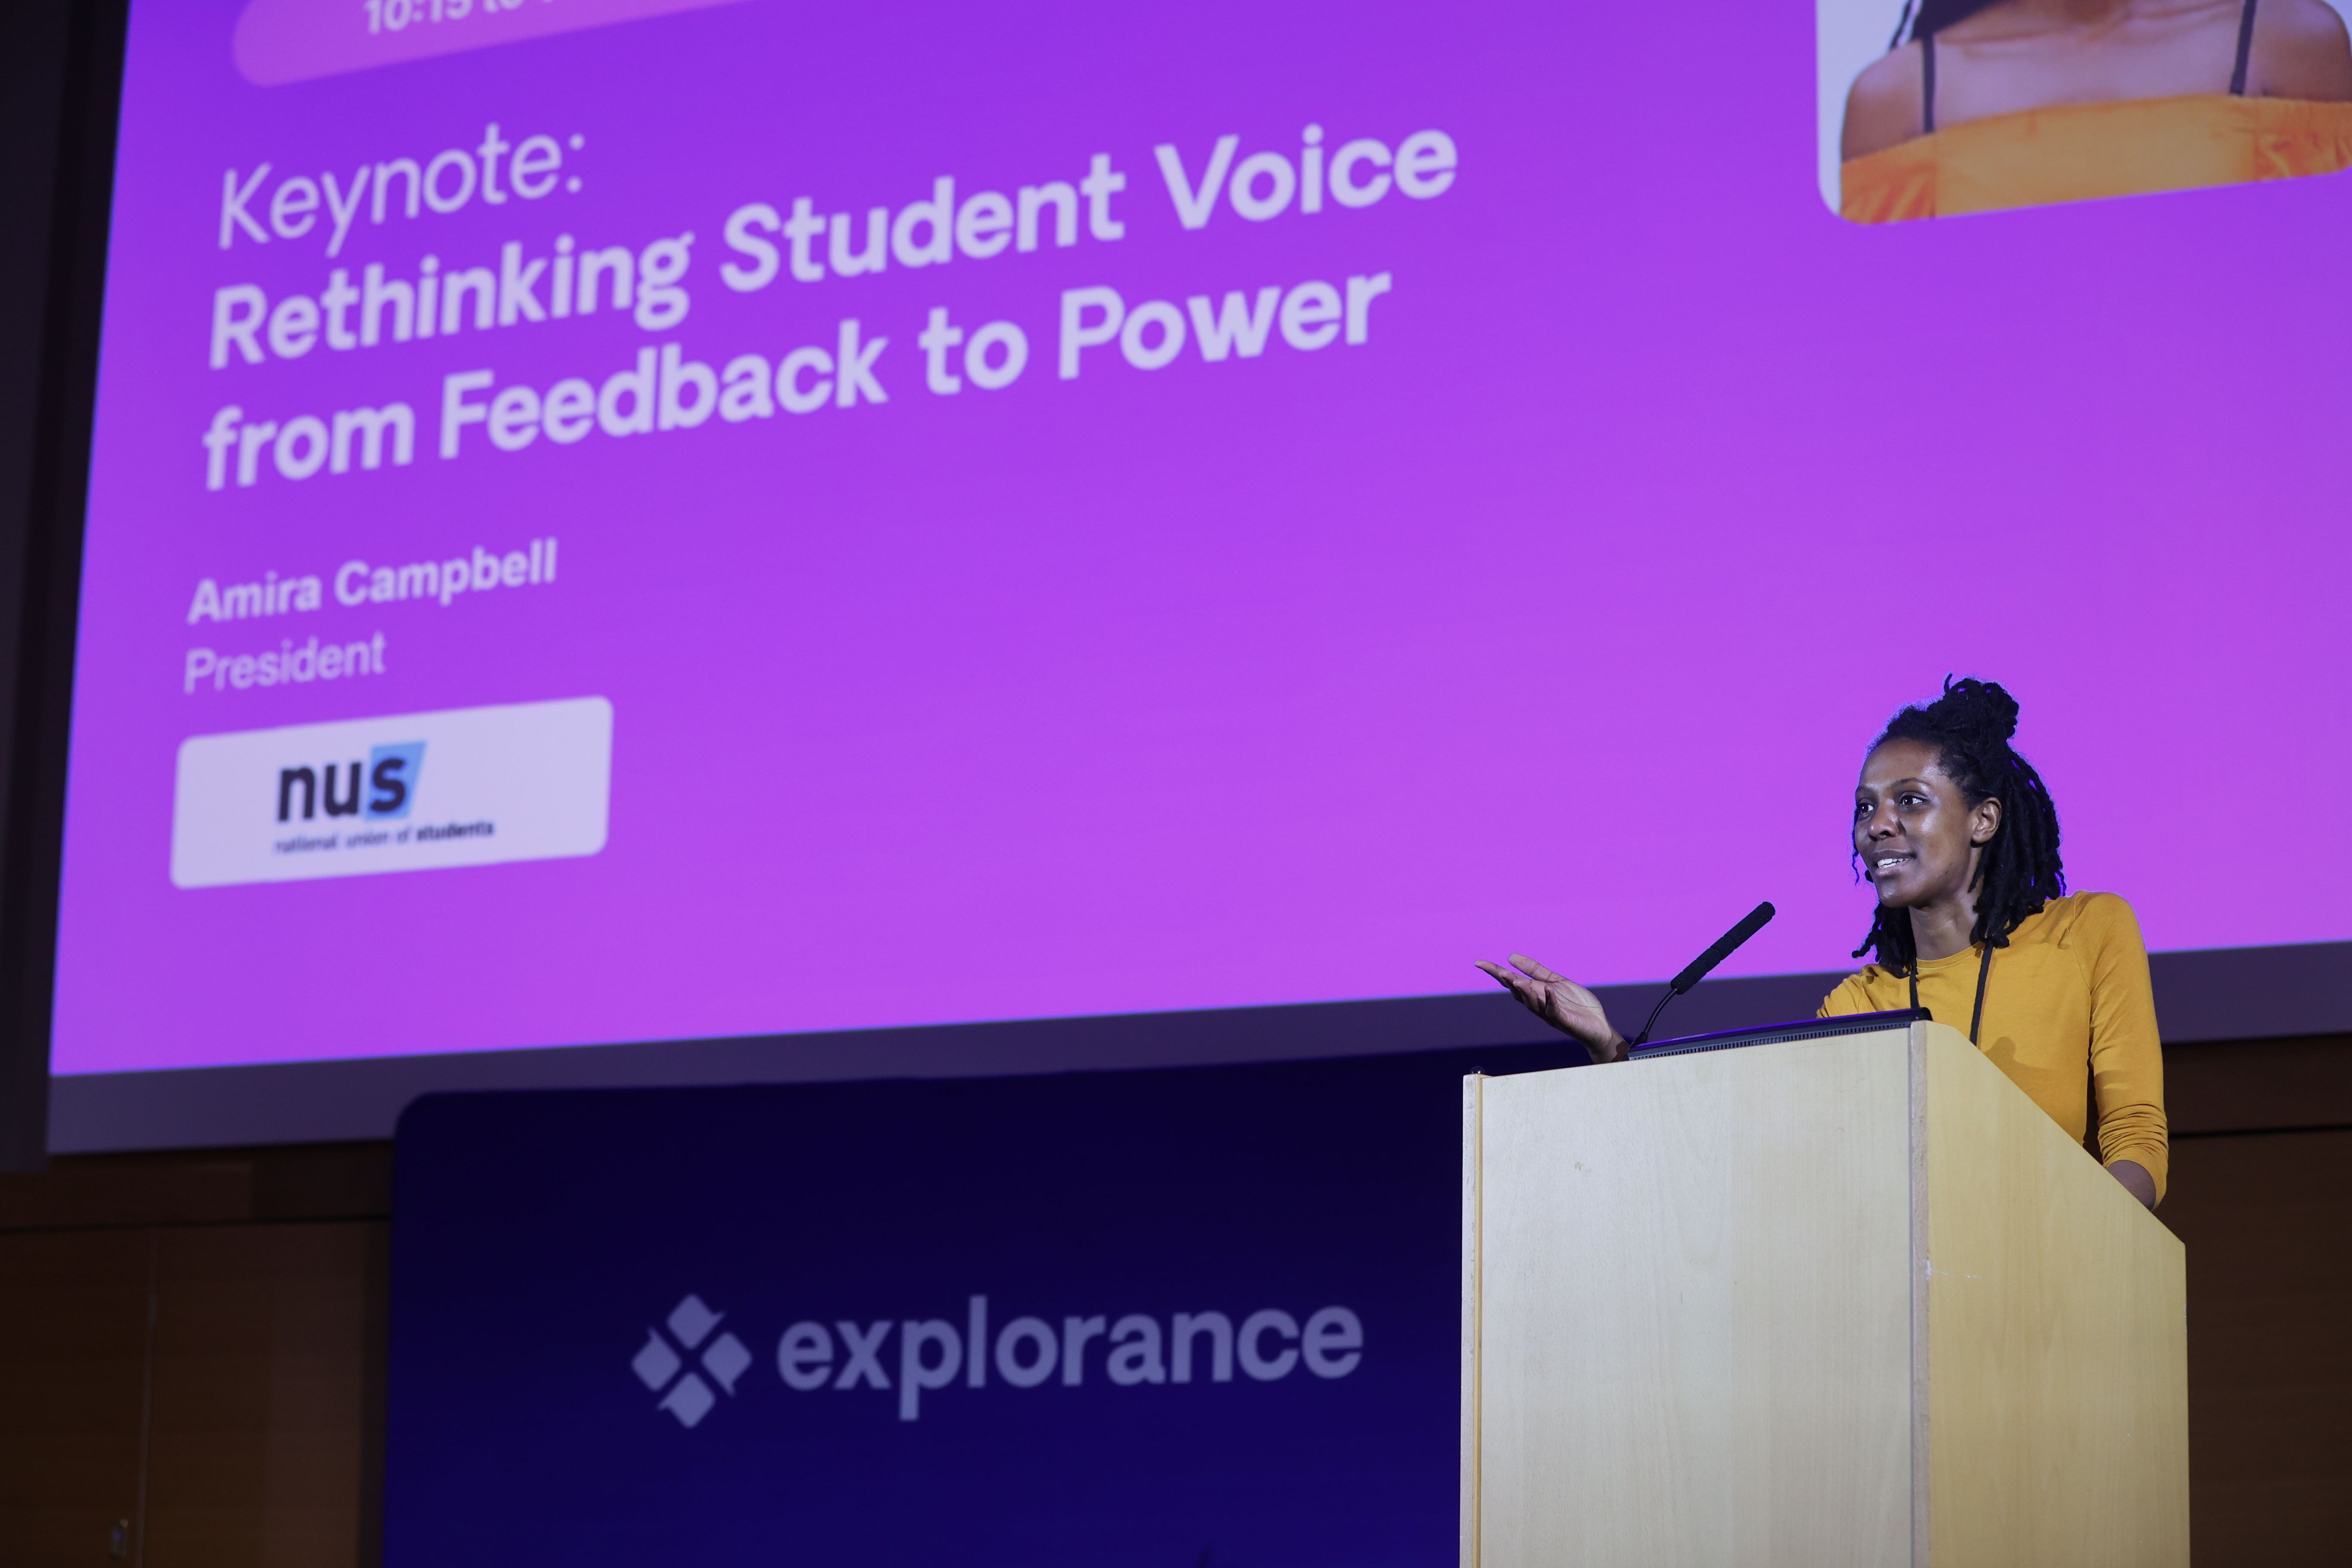
The Transformation of Student Engagement: From Partnership to Power (NUS Guest Post)
NUS President Amira Campbell explains why students are demanding accountability over feedback and what that shift means for higher education institutions.
7 min read

BlueX 2.1: Strengthening Trust, Governance, and Action Across the Feedback Lifecycle
BlueX 2.1 strengthen survey governance, protect respondent confidentiality, organize workspaces, and boost participation with QR code surveys and live reporting widgets.
3 min read
Explorance Blue Is WCAG 2.2 AA Certified: Why That Matters
Explorance Blue is WCAG 2.2 certified, delivering inclusive, barrier-free feedback experiences across institutions and organizations while reducing compliance risk and ensuring every voice is heard
4 min read
5 Highlights From the 2026 Student Voices in Higher Education Conference
Higher education leaders shared strategies for embedding student voice in governance and feedback systems. See key takeaways from the 2026 London event.
7 min read
Convince Your Manager to Attend Explorance World 2026: Step-by-step Guide and Free Template
Download a justification letter template and get role-specific talking points to secure manager approval for Explorance World 2026 in Boston.
6 min read
Connecting Learning to Business Value: Practical Approaches to Measuring Skills
Discover actionable strategies to connect skill development to business outcomes in L&D.
8 min read
Faster, Clearer, and More Self-Sufficient Learning Measurement with Explorance MTM 9.5
Explore what’s new in Explorance MTM 9.5—faster dashboards, smarter qualitative feedback filters, and a new Help Center for more self-sufficient L&D teams.
2 min read
Faster, Smarter, More Accessible Feedback Analytics with Explorance Blue 9.6
Explore the latest Blue 9.6 update, featuring faster report generation, full accessibility compliance, improved project management, and enhanced AI-powered feedback analysis
3 min read


Newsletter
Stay connected with the latest updates and news from Explorance.
'%3e%3cpath%20d='M5.83968%2010.4004L7.09855%2015.7752L1.29959%2021.5843L1.23852%2021.642C1.21137%2021.6692%201.18762%2021.6997%201.16047%2021.7235C0.481112%2022.4372%200.0747675%2023.3674%200.0127211%2024.3508C-0.0493254%2025.3343%200.236888%2026.3082%200.821155%2027.1016C0.885626%2027.1865%200.950095%2027.2713%201.01796%2027.3493C1.0306%2027.3649%201.0442%2027.3796%201.05868%2027.3935C1.16422%2027.5192%201.27755%2027.6382%201.398%2027.7497L1.4455%2027.7939L1.67624%2028.0246L9.14125%2035.4896L20.0334%2024.6043L5.83968%2010.4004Z'%20fill='white'/%3e%3cpath%20d='M13.1078%2039.4493L9.78247%2042.761L15.1539%2041.5055L20.98%2047.3113L21.0411%2047.369L21.1225%2047.4504C21.8375%2048.1288%2022.7681%2048.5345%2023.7517%2048.5965C24.7354%2048.6585%2025.7096%2048.373%2026.5041%2047.7897C26.5889%2047.7253%2026.6737%2047.6608%2026.7518%2047.5929L26.7959%2047.5522C26.9233%2047.4401%2027.0434%2047.3199%2027.1556%2047.1925C27.1709%2047.1795%2027.1845%2047.1647%2027.1963%2047.1484L27.4304%2046.9211L34.8954%2039.4561L23.9999%2028.5605L13.1078%2039.4493Z'%20fill='white'/%3e%3cpath%20d='M34.8921%209.76194L38.2072%206.45019L32.8358%207.70228L27.0199%201.89315L26.9588%201.83207C26.9317%201.80492%2026.9045%201.78117%2026.8808%201.75403C26.1658%201.07561%2025.2352%200.669967%2024.2515%200.607946C23.2679%200.545924%2022.2937%200.831473%2021.4992%201.41471L21.2515%201.61491L21.204%201.65902C21.0833%201.7643%2020.9699%201.87767%2020.8646%201.99833L20.8239%202.04245L20.5932%202.2664L13.1282%209.73141L23.9999%2020.6473L34.8921%209.76194Z'%20fill='white'/%3e%3cpath%20d='M47.1789%2022.1067C47.1181%2022.0204%2047.0524%2021.9377%2046.9821%2021.859L46.9414%2021.8149C46.8301%2021.6867%2046.7099%2021.5665%2046.5817%2021.4552L46.5376%2021.4145L46.3069%2021.1838L38.8419%2013.7188L27.9531%2024.6041L38.8419%2035.4928L42.157%2038.8046L40.9015%2033.4332L46.7073%2027.624L46.7683%2027.5663L46.8464%2027.4815C47.5267%2026.769%2047.9337%2025.8392%2047.9958%2024.856C48.0579%2023.8727%2047.771%2022.8992%2047.1857%2022.1067H47.1789Z'%20fill='%230050C1'/%3e%3c/g%3e%3cdefs%3e%3cclipPath%20id='clip0_6641_12689'%3e%3crect%20width='48'%20height='47.9966'%20fill='white'%20transform='translate(0%200.603516)'/%3e%3c/clipPath%3e%3c/defs%3e%3c/svg%3e)
Copyright 2026 © Explorance Inc. All rights reserved.