Wired to Know: 10 Highlights from the Explorance Europe Summit 2026



How can universities ensure that student feedback leads to visible change? And how can technology help institutions understand students’ experiences while giving them greater influence over what happens next?
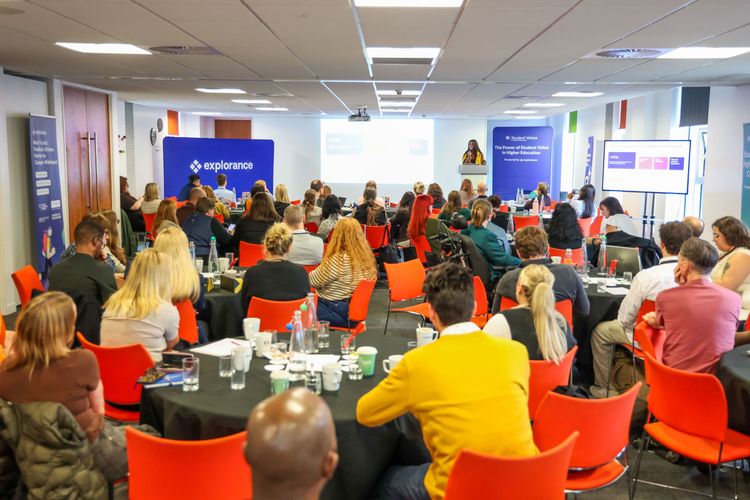
These questions brought the Explorance community together for the Europe Summit 2026 in Manchester hosted on 13-14 October.
Inspired by the global theme “Wired to Know”, the Summit explored how connected feedback ecosystems can turn information into actionable intelligence. University presentations, product insights and practical discussions demonstrated how institutions are using Explorance Blue and MLY to strengthen teaching, support student development and inform decision-making.
Here are 10 highlights from the event:
1. Beyond Listening: From Student Voice to Student Influence
Professor Rob Appleby, Associate Vice President for Students at the University of Manchester, opened his Day 1 keynote with a challenge: listening to students is only the beginning.
Drawing on research and Manchester’s strategy to maximise student success, he explored the evolution of student voice and the role of technology in translating feedback into meaningful influence.
Moving beyond simply communicating what an institution has done in response to feedback means involving students in defining problems, interpreting evidence, designing responses and evaluating whether changes work. At Manchester, this includes involving students early in the Manchester 2035 strategy, strengthening Students’ Union partnerships and connecting student evidence to named leaders accountable for action.
Professor Appleby said: “We need the voice of the holistic student and a mix of surveys for scale, representation, partnership and co-creation. This should give influence and change. Technology should shorten the distance between student experience and institutional change.”
Describing Explorance at the University of Manchester as “impressive”, he highlighted the scale of its use:
• Approximately 15 survey projects built each year, spanning more than five distinct types, each with manually produced data. • 248 questions across survey activity, down from 282 in 2024/25. • More than 37,000 students invited to share their views and experiences, across 285,700 survey instances. • Approximately 55,500 comments submitted and analysed, supported by MLY. • More than 8,000 reports generated and distributed.
The central question was what happens next: how does this insight change practice and give students greater influence over their university experience?
Further reading:
2. Counting what Counts: Using Blue to Track and Support Students’ Educational Gains
The University of Manchester also discussed how Blue can support students in recognising and articulating their wider development.
Jen McBride, Co-Chair of the Educational Gains Group, and Daniel Bayes, Teaching and Learning Officer, presented My Manchester Experience – a self-reflection tool, co-created and tested with students, addressing an important question: what do students gain from university beyond their academic qualifications?
Developed through student and alumni consultation, the approach covers areas including confidence, skills, belonging and future readiness. Students receive personalised reports with reflection prompts and links to relevant development opportunities.
Around 900 students completed the self-reflection during the 2025/26 pilots. Participation exceeded 60% where a familiar member of staff introduced the activity in class, demonstrating the importance of embedding it in students’ existing learning experiences.
Programme teams identified uses for the resulting insight in academic advising, programme planning and student support. Every participating programme team said it would choose to continue using the approach.
The presentation’s conclusion captured its purpose: moving from measuring outcomes to understanding development, and using that insight to improve the student experience.
3. Data and Evidence, Insight and Action, Improving the Process at the University of Strathclyde
Professor Brian Green, Deputy Associate Principal (Academic Quality & Student Experience), and Lorna Robertson, Student Surveys Officer (Education Insight), explained how the University of Strathclyde connects student feedback with quality assurance and enhancement.
Following the principles of Scotland’s Tertiary Quality Enhancement Framework (TQEF), their presentation brought together surveys, module evaluation, dashboards, qualitative analysis and partnership working with the Students’ Union.
Now in its sixth year, student module evaluation through Blue embeds mechanisms for closing the feedback loop. Central analysis of free-text comments, supported by MLY, contributes to thematic reporting on areas including assessment and feedback, cost of living, demographics and retention.
Making evidence accessible enables colleagues to investigate local experiences and identify appropriate actions. Integrating it into review and planning processes helps student voice inform institutional improvement.
As part of the University’s Tertiary Quality Enhancement Review (TQER) report and action plan, features of good practice highlighted by QAA Scotland in 2026 included: “The student voice is heard and valued throughout the University, and across diverse student groups, which leads to timely action and meaningful change.”
4. Using MLY Analysis to Identify Evidence for Institutional Change
At the University of Worcester, Head of Performance & Insight Carolyn Moir showed how a focused project can help institutions begin using qualitative analysis strategically.
Following five years of Blue use, Worcester implemented MLY in September 2026. An initial project brought together approximately 2,500 responses from four internal and external surveys to explore communication with students.
The analysis was designed to support a communications project linked to the University’s Retention Steering Group. “MLY provides an opportunity to gain better understanding”, she said.
Carolyn also highlighted questions institutions should ask when interpreting findings: does the analysis challenge existing assumptions, is the sample sufficient, and would including positive comments provide a more balanced understanding?
Her example demonstrated the value of starting with a clear institutional question and using MLY to explore the evidence available.
Further reading:
5. DIG in Practice: Cleaner Data, Smoother Workflows
Dan Morton, Surveys and Data Insight Analyst, detailed how the University of Sheffield uses Explorance’s Data Integrity Gateway (DIG) alongside Blue to simplify survey administration and manage complex data requirements.
Since implementing Blue in 2020, Sheffield has used DIG to bring tasks together in one place, capture information missing from central datasets and provide access for colleagues such as co-module and programme leads.
The platform also supports bespoke requirements, including splitting Medicine modules into teaching blocks and enabling the relevant Student Experience Team to configure placement surveys directly.
Dan discussed how small changes can save time. Adding a specific report release date within DIG has reduced the need to adjust scheduling within individual reports.
His practical message was that greater control over data helps the team meet different programme requirements while making tasks easier for schools to complete.
Further reading:
6. Turning Voices into Action: The Duty to Use Open Comment Data
For Kirsty Scanlan, Global Director of Strategic Planning & Performance at Heriot-Watt University, analysing qualitative feedback is a matter of institutional responsibility.
Her presentation began by explaining why qualitative comments matter: they provide insight into lived experience and institutional culture, explain why issues occur and capture nuance missing from numerical scores.
Addressing the problem of “underused voices”, she argued that asking for feedback creates an obligation to consider it seriously. Leaving comments unread risks weakening trust and discouraging future participation.
Heriot-Watt illustrated how MLY makes comprehensive analysis more manageable. Processing approximately 50,000 comments annually previously required 225 hours; with MLY, this reduced to 4.5 hours, a 98% reduction.
Combining qualitative analysis with quantitative dashboards helps colleagues understand both what is happening and why. Human oversight remains central, with faster analysis helping leaders identify patterns sooner, understand context and respond transparently to students and staff.
Kirsty commented: “Collecting feedback without acting on it is ethically problematic. Turning voices into action is what we’re here to do. Explorance MLY is a transformative solution.”
Further reading:
7. Beyond the Survey: When Data Knows Before You Ask
In the first session of Day 2, Samit Lotlikar, Institutional Research and Data Analytics Manager at Zayed University, shared the University’s journey towards a connected institutional feedback ecosystem.
Blue has supported its evaluations since 2016, integrating with institutional systems to manage feedback across teaching, learning and services. Eighteen surveys are administered centrally through Blue, alongside additional ad hoc surveys each academic year.
The next opportunity is to make fuller use of the information already collected.
Zayed demonstrated how MLY surfaces topics, sentiment, recommendations and comments requiring follow-up, while dashboards allow colleagues to explore findings at different organisational levels.
Connecting scores with comments can help distinguish between issues relating to teaching and those concerning course design, giving academic leaders a clearer starting point for investigation.
Samit said: “Explorance Blue is ZU’s institutional listening backbone. One platform runs ZU’s entire survey ecosystem. MLY turns comments into intelligence. The qualitative feedback you already collected – read in full, in minutes, by AI.”
8. Using Question Personalisation to Inform Institutional Change: Focus on Intellectually Stimulating Teaching
Dr Elena Zaitseva, Head of Student Voice and Evaluation, discussed how Liverpool John Moores University uses Blue’s Question Personalisation functionality to investigate intellectually stimulating teaching.
An optional question bank generated 4,270 responses across 218 modules, providing richer evidence than a single headline measure.
Students associated intellectual stimulation with encountering different perspectives, applying knowledge to real-world situations and participating actively in learning. Their feedback also highlighted the importance of support alongside challenge, including clearer guidance, examples and opportunities to practise.
Dr Zaitseva emphasised that measuring whether students feel intellectually stimulated is insufficient without understanding the learning experiences that create that stimulation, including the perspectives of students who may otherwise remain unheard.
The findings are being triangulated with outcomes from two student-led projects and will contribute to the University’s evaluation of intellectual stimulation.
Further reading:
9. Transforming NSS Insights for All: Collaboration Behind the MLY NSS Model
Ursula McTaggart from Ulster University, Natalie Holland from Liverpool John Moores University and Penny Jones from the University of Brighton joined a panel exploring how institutions can get more value from National Student Survey feedback.
The discussion considered the challenges and opportunities NSS data presents, drawing on panellists’ experiences before adopting MLY. It then turned to MLY’s role in qualitative analysis and the benefits of the customised MLY NSS Model.
A practical focus was how the model can support faster, more consistent reporting and help institutions close the feedback loop sooner. The panel also considered reasons for adoption and advice for peers seeking to translate qualitative insights into tangible improvements in the student experience.
“The NSS custom model that Explorance introduced was a game changer for me,” Penny revealed. “It meant that I could put the comments in and get something sensible out that was reflective of the structures we use internally.”
Further reading:
- Insights at speed and scale: Explorance introduces a new AI model to analyse NSS open-ended feedback
- Why UK Universities Partnered with Explorance to Solve NSS Comment Analysis
- How the University of Brighton Saved 4 Weeks on Comment Analysis with Explorance MLY
- How University of Nottingham Cuts Time Spent Analysing Student Feedback by 70%
- From 6.5% to Nearly 30% Engagement: The Measurable Impact of Explorance Blue and MLY at Ulster University
10. Global Response Rates Tournament 2026: Results, Takeaways & Best Practices
Among the Explorance presentations, Chief Marketing Officer Anastasia Tsimiklis shared findings from the Global Response Rates Tournament 2026, exploring practical approaches to strengthening survey participation.
Across 85 submissions, covering 762,206 survey respondents, the average response rate was 74.5%. Purposeful communication was cited in 92% of submissions, while 89% highlighted instructor or leader engagement and 79% used strategies focused on timing and frequency.
Case studies from the University of Sharjah, the University of Nevada, Las Vegas, and the University of Newcastle, Australia, illustrated how survey access and delivery can affect participation. At Newcastle, the loss of Canvas integration introduced additional steps for students and response rates declined, underlining the value of accessible surveys within familiar systems.
Closing the feedback loop was cited in only 11% of submissions, highlighting an opportunity for institutions to build trust by showing students how their feedback informs change.
To register to receive the full report, which launches in November, visit the Global Response Rates Tournament page.
Phil is a specialist PR, communications and stakeholder engagement consultant with 25 years’ experience in both in-house and consultancy roles. He supports universities and schools, as well as commercial organizations targeting the education sector, to support their profile, reputation and business development objectives.
Related Articles




Learn more about Explorance's products, solutions, and the company.

