Guided by a Single Source of Truth
With centralized course evaluations across your institution, IR teams gain the consistency they need to become trusted strategic partners.
Explorance helps universities worldwide make sure the effort they put into their course evaluations pays off. Replace ad hoc requests with governed self-service access, eliminate conflicting “versions of truth,” ensure the correct data is powering your automation and drive high engagement throughout the campus.

Students engaged

QS World Universities

Typical response rate






















With Explorance you move away from conflicting sources of truth erode data credibility, constant ad hoc data requests that turn IR teams reactive.
With centralized course evaluations across your institution, IR teams gain the consistency they need to become trusted strategic partners.
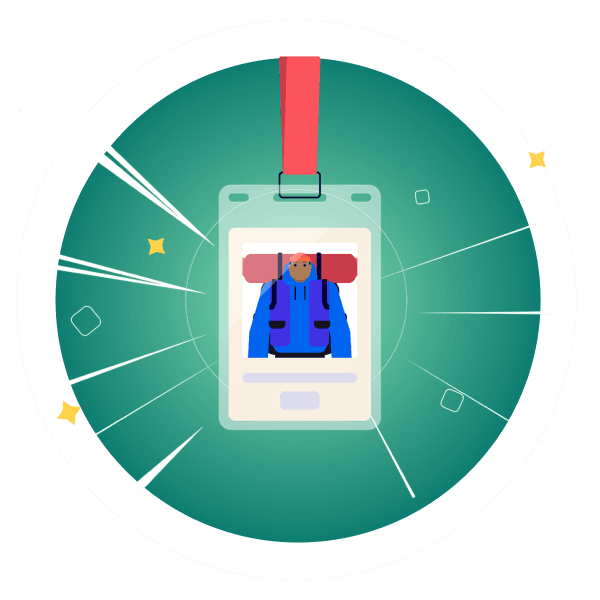
Role-based dashboards free up capacity for the strategic, forward-looking work that actually shapes institutional outcomes.
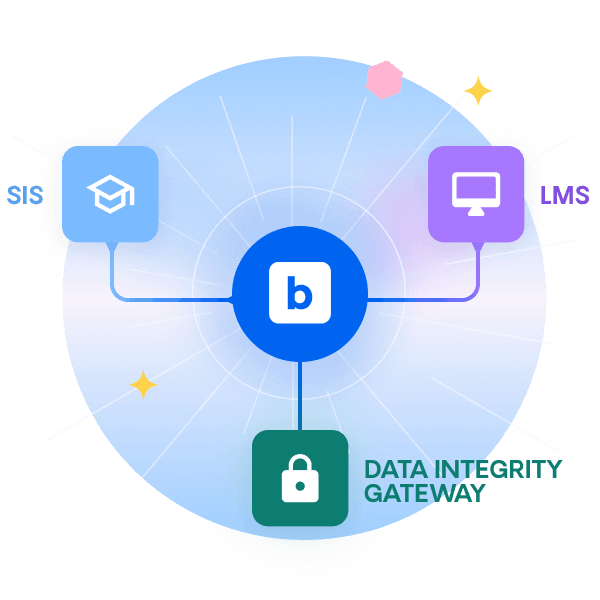
Deep SIS and LMS integrations ensure IR reports are always up to date, regardless of changes within the institution.

'%3e%3cpath%20d='M38.6018%2017.0683H33.4083V14.6677C33.4083%209.91554%2035.6055%205.55531%2039.4008%202.61583C39.4507%202.61583%2039.4507%202.56683%2039.5007%202.51784V2.46885C40%202.02793%2040.0999%201.34205%2039.6505%200.803146C39.4008%200.509198%2038.9513%200.313232%2038.5518%200.362224C38.5019%200.362224%2038.452%200.313232%2038.402%200.313232C29.4133%201.29306%2022.3721%209.22966%2022.3721%2018.3421V32.9905C22.3721%2033.7253%2022.9713%2034.3132%2023.7204%2034.3132H38.6517C39.4008%2034.3132%2040%2033.7253%2040%2032.9905V18.3421C39.9501%2017.6562%2039.3508%2017.0683%2038.6018%2017.0683Z'%20fill='%23A777FE'/%3e%3cpath%20d='M16.2797%2017.0683H11.0362V14.6677C11.0362%209.91554%2013.2335%205.55531%2017.0287%202.61583C17.0787%202.61583%2017.0787%202.56683%2017.0787%202.51784C17.1119%202.51784%2017.1286%202.50151%2017.1286%202.46885C17.578%202.02793%2017.6779%201.34205%2017.2784%200.803146C16.9788%200.509198%2016.5793%200.313232%2016.1798%200.362224C16.1298%200.362224%2016.0799%200.313232%2016.03%200.313232C7.04619%201.29306%200%209.22966%200%2018.3421V32.9905C0%2033.7253%200.599251%2034.3132%201.34831%2034.3132H16.2797C17.0287%2034.3132%2017.628%2033.7253%2017.628%2032.9905V18.3421C17.578%2017.6562%2016.9788%2017.0683%2016.2797%2017.0683Z'%20fill='%23A777FE'/%3e%3c/g%3e%3cdefs%3e%3cclipPath%20id='clip0_2795_41031'%3e%3crect%20width='40'%20height='34'%20fill='white'%20transform='translate(0%200.313232)'/%3e%3c/clipPath%3e%3c/defs%3e%3c/svg%3e)





High complexity structures like cross-listed, team-taught, and variable-length courses are flawlessly automated with correct reporting. Even with late registrations, withdrawals, and faculty reassignments, course evaluation feedback is captured accurately in reports.
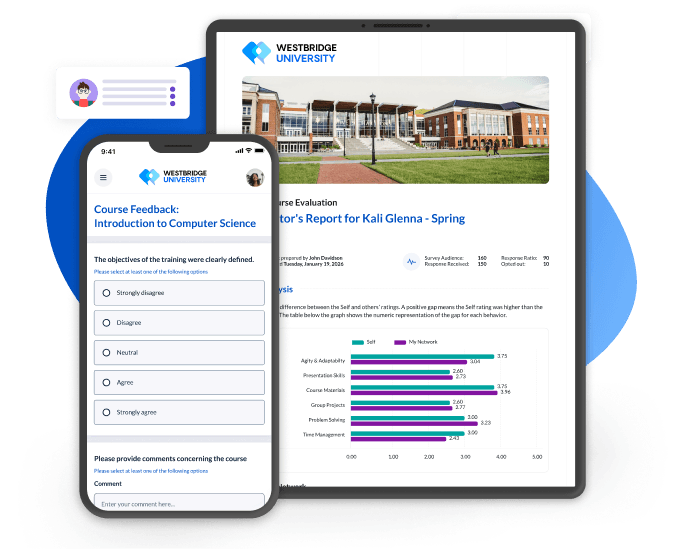
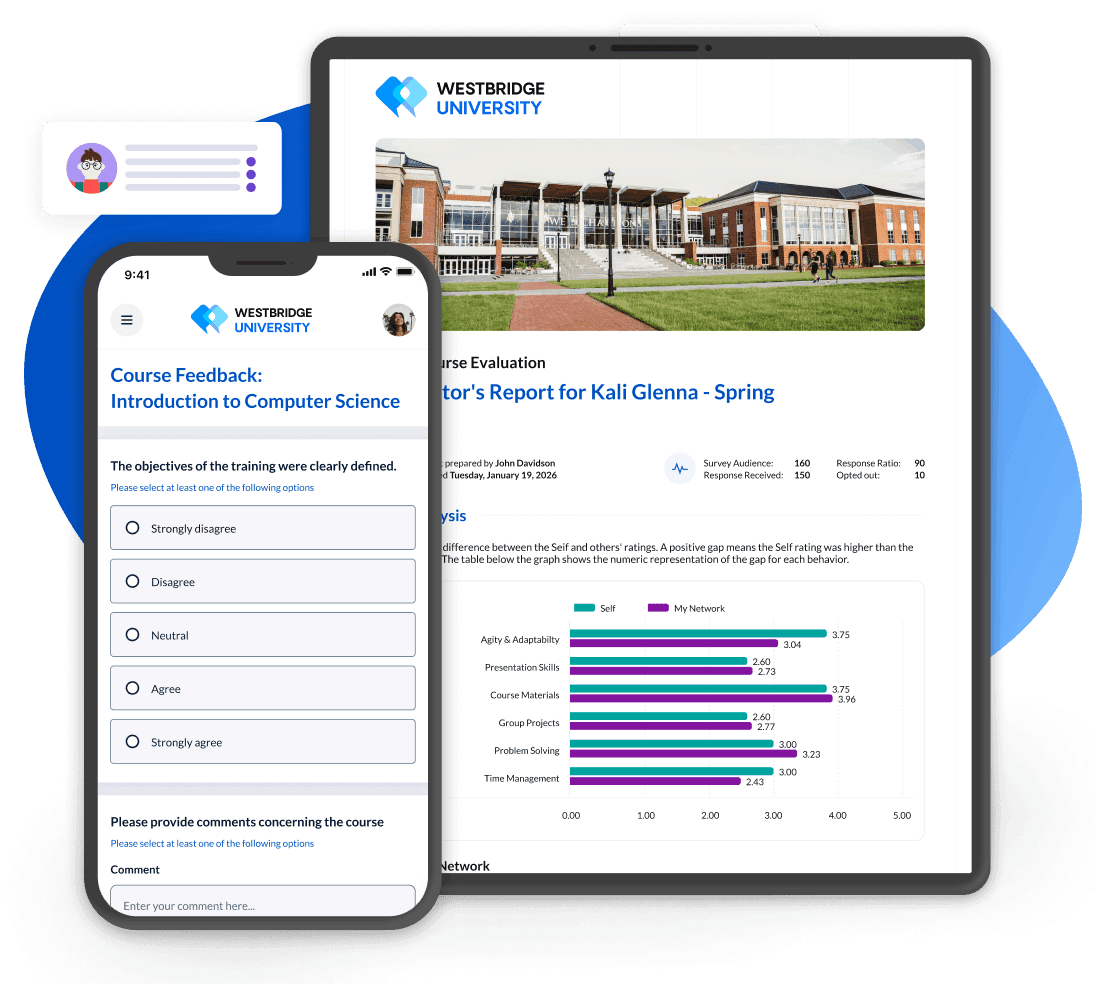
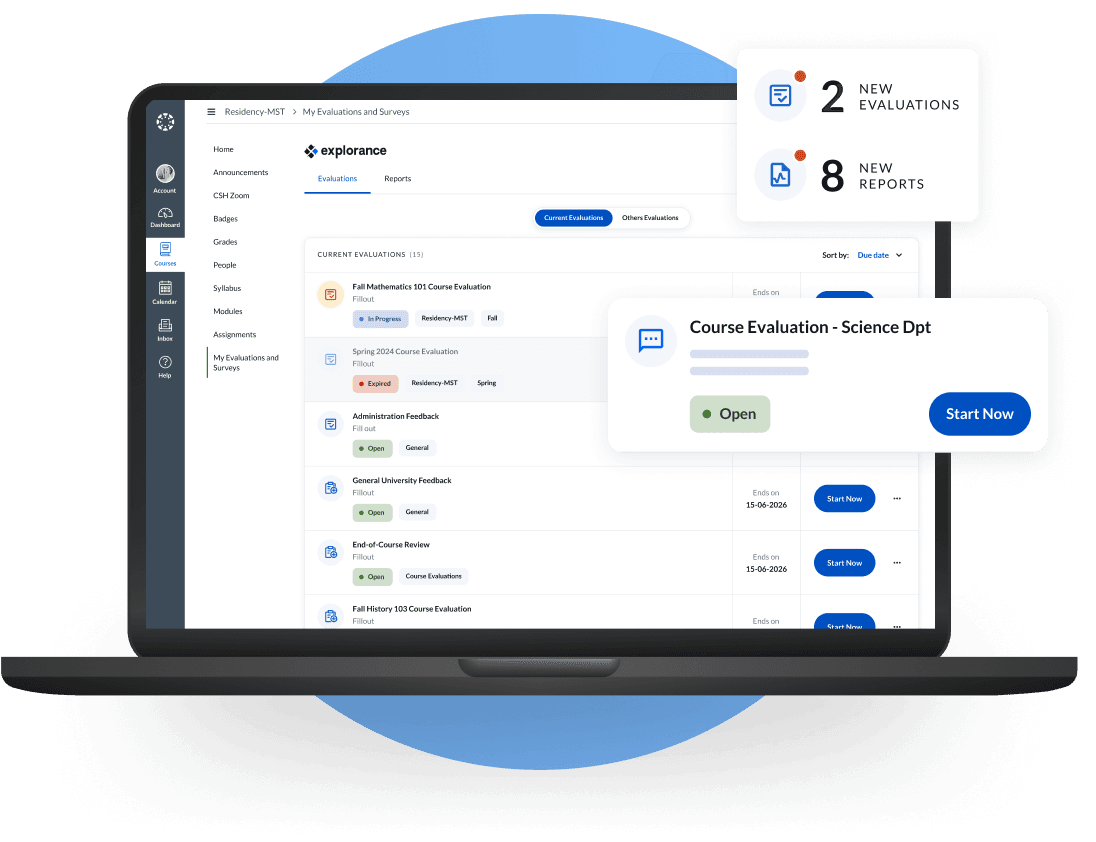
Students can access their surveys via email, SMS, QR codes, their LMS portal, or printouts. They can give feedback knowing strict privacy thresholds protect their identities. The Response Rate Monitor lets administrators, educators, and other authorized users track progress over time.
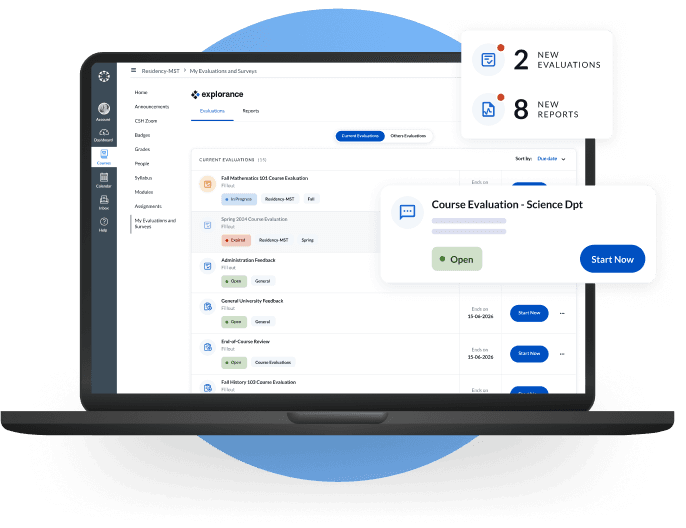
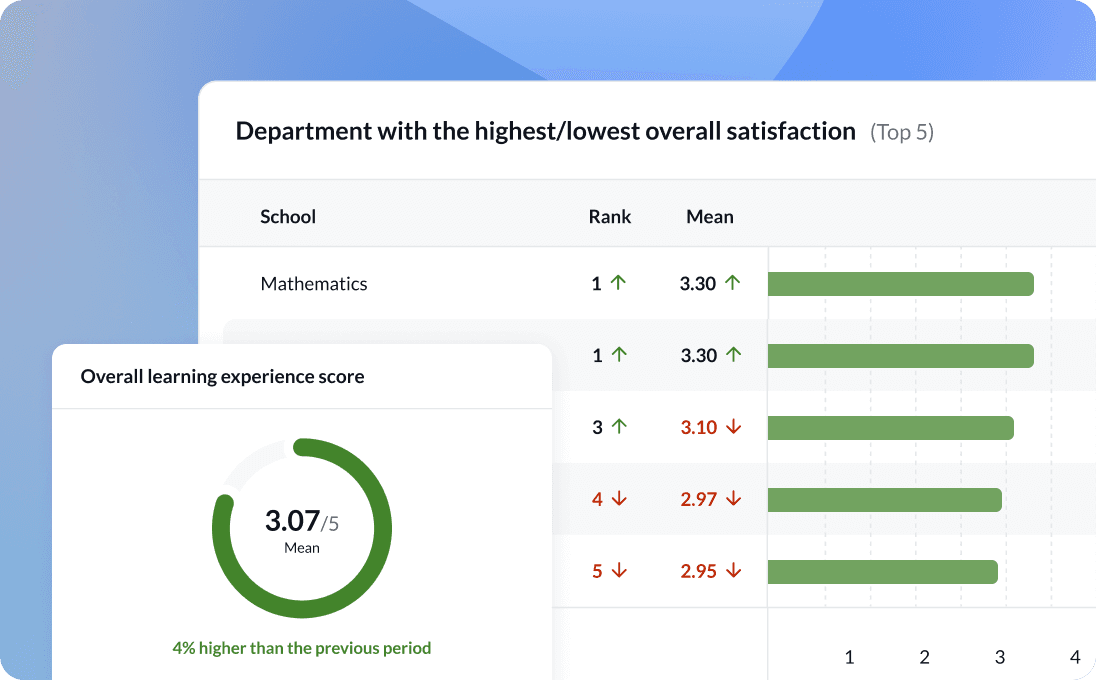
Consolidate course evaluation insights into centralized dashboards that translate complex data into clear findings. Visualizations present insights clearly for a wide range of stakeholders. From accreditation evidence to strategic planning, everyone gets a single, reliable source of truth they can act on.
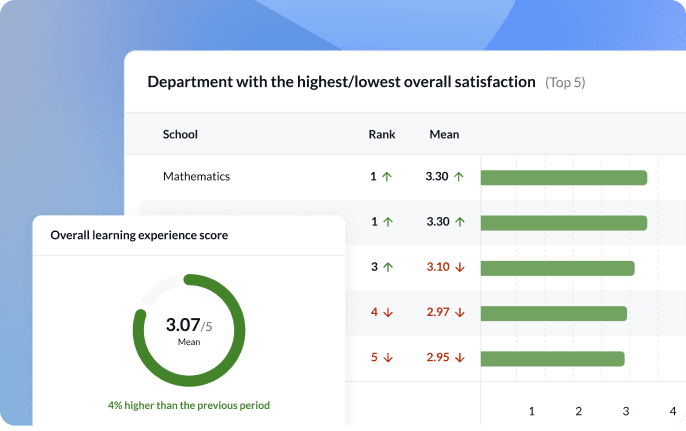

Leaders can monitor patterns, compare units, and identify trends to support strategic planning. Centralized dashboards translate complex data into clear, easy-to-understand data narratives.

Empower chairs, deans, and program directors with unit-level insights so they can make informed decisions on faculty development, program reviews, and enhanced curriculum.

Equip faculty with timely, easy-to-interpret results alongside meaningful benchmarks. This contextualizes their performance and supports continuous teaching excellence.
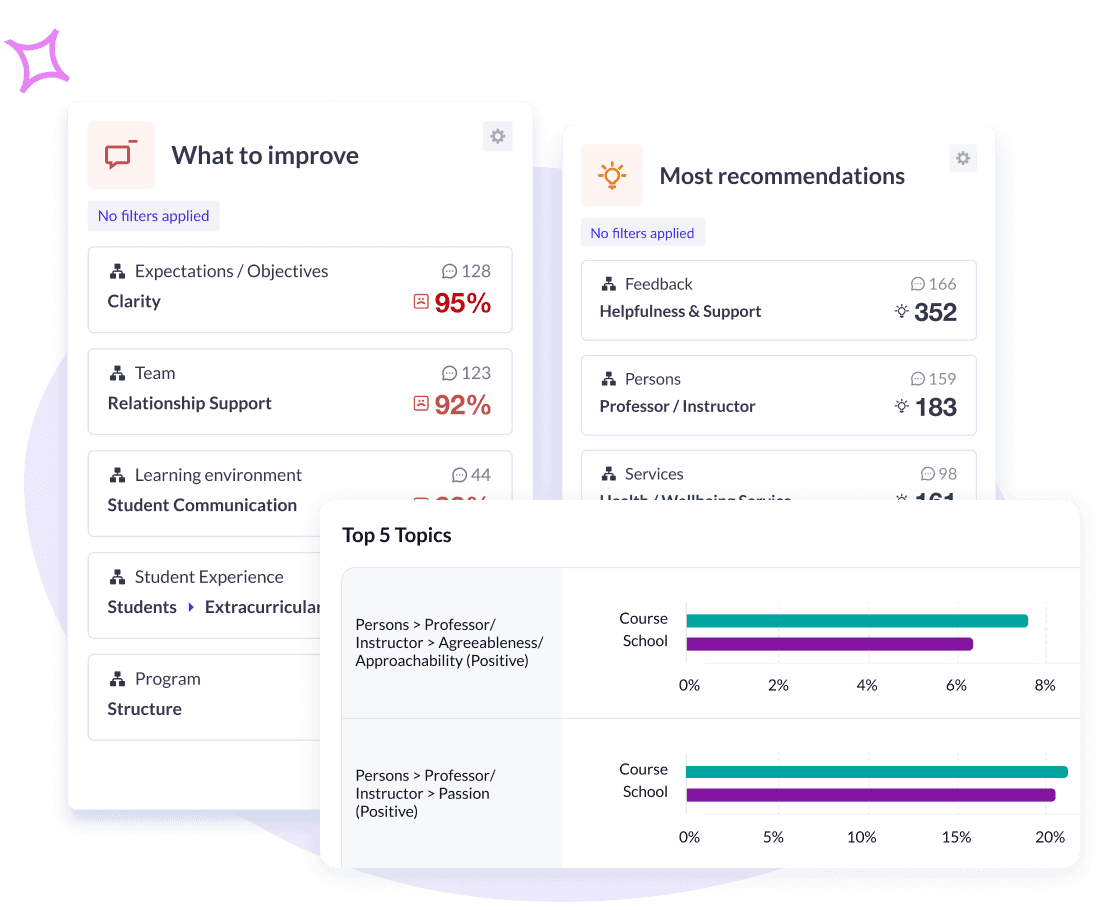
Explorance MLY turns open-text comments from course evaluations into clear, decision-ready insights. By surfacing patterns, tracking sentiment, and flagging critical alerts, it eliminates manual analysis while generating appropriate reports for leadership, faculty and administrators.
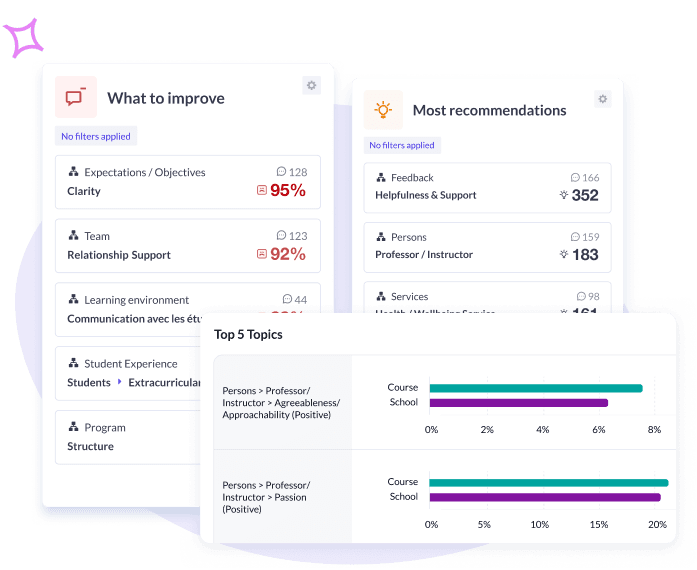
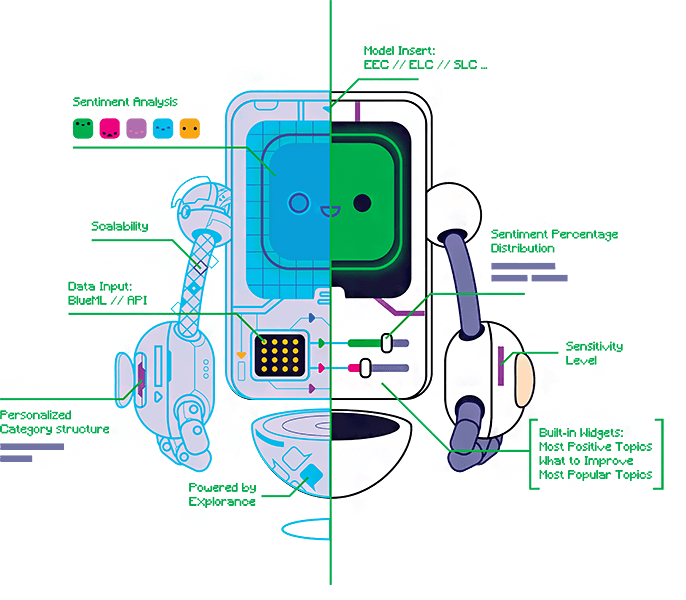
Every institution has a unique tenure & promotion approach, strategic plan pillars, accreditation standards, and social equity commitments. MLY’s student feedback model can be customized to match your world more accurately, no matter if you’re following a national student feedback framework, developed your own methodology or are interested in a sub-set of themes for a specific use.
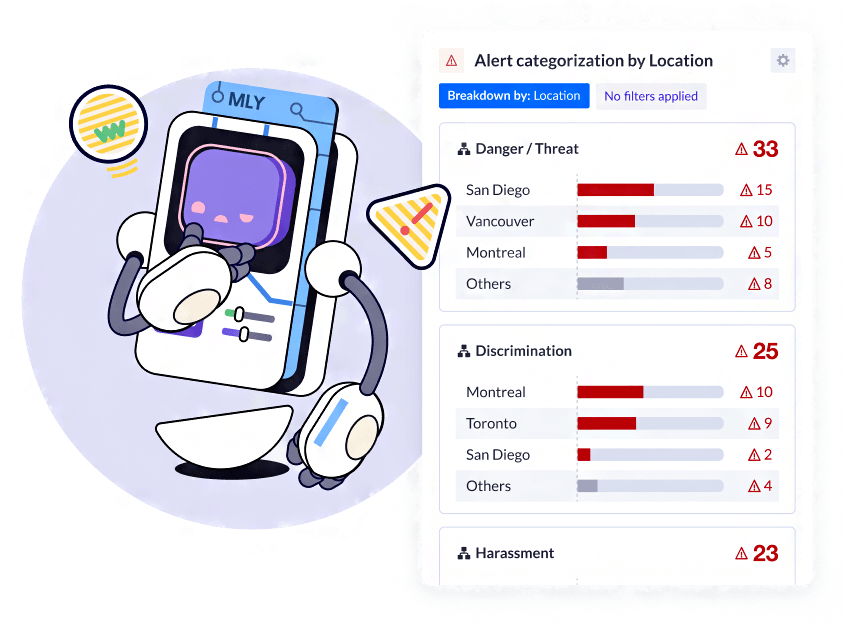
MLY automatically scans open-ended feedback and flags potentially concerning comments across critical alert categories, from threats and discrimination to mental and physical safety. Configurable blocks display feedback, alerts only, or specific topics, enabling authorized reviewers to quickly triage, assess, and route issues through established institutional protocols.
Data is synchronized with your SIS, LMS and other existing sources, giving you the full picture. SIS systems like Ellucian and PeopleSoft provide the most trustworthy source of truth and demographic data you can filter by. Deep integrations with LMS platforms like Blackboard and Canvas enables better student engagement through embedded survey distribution.
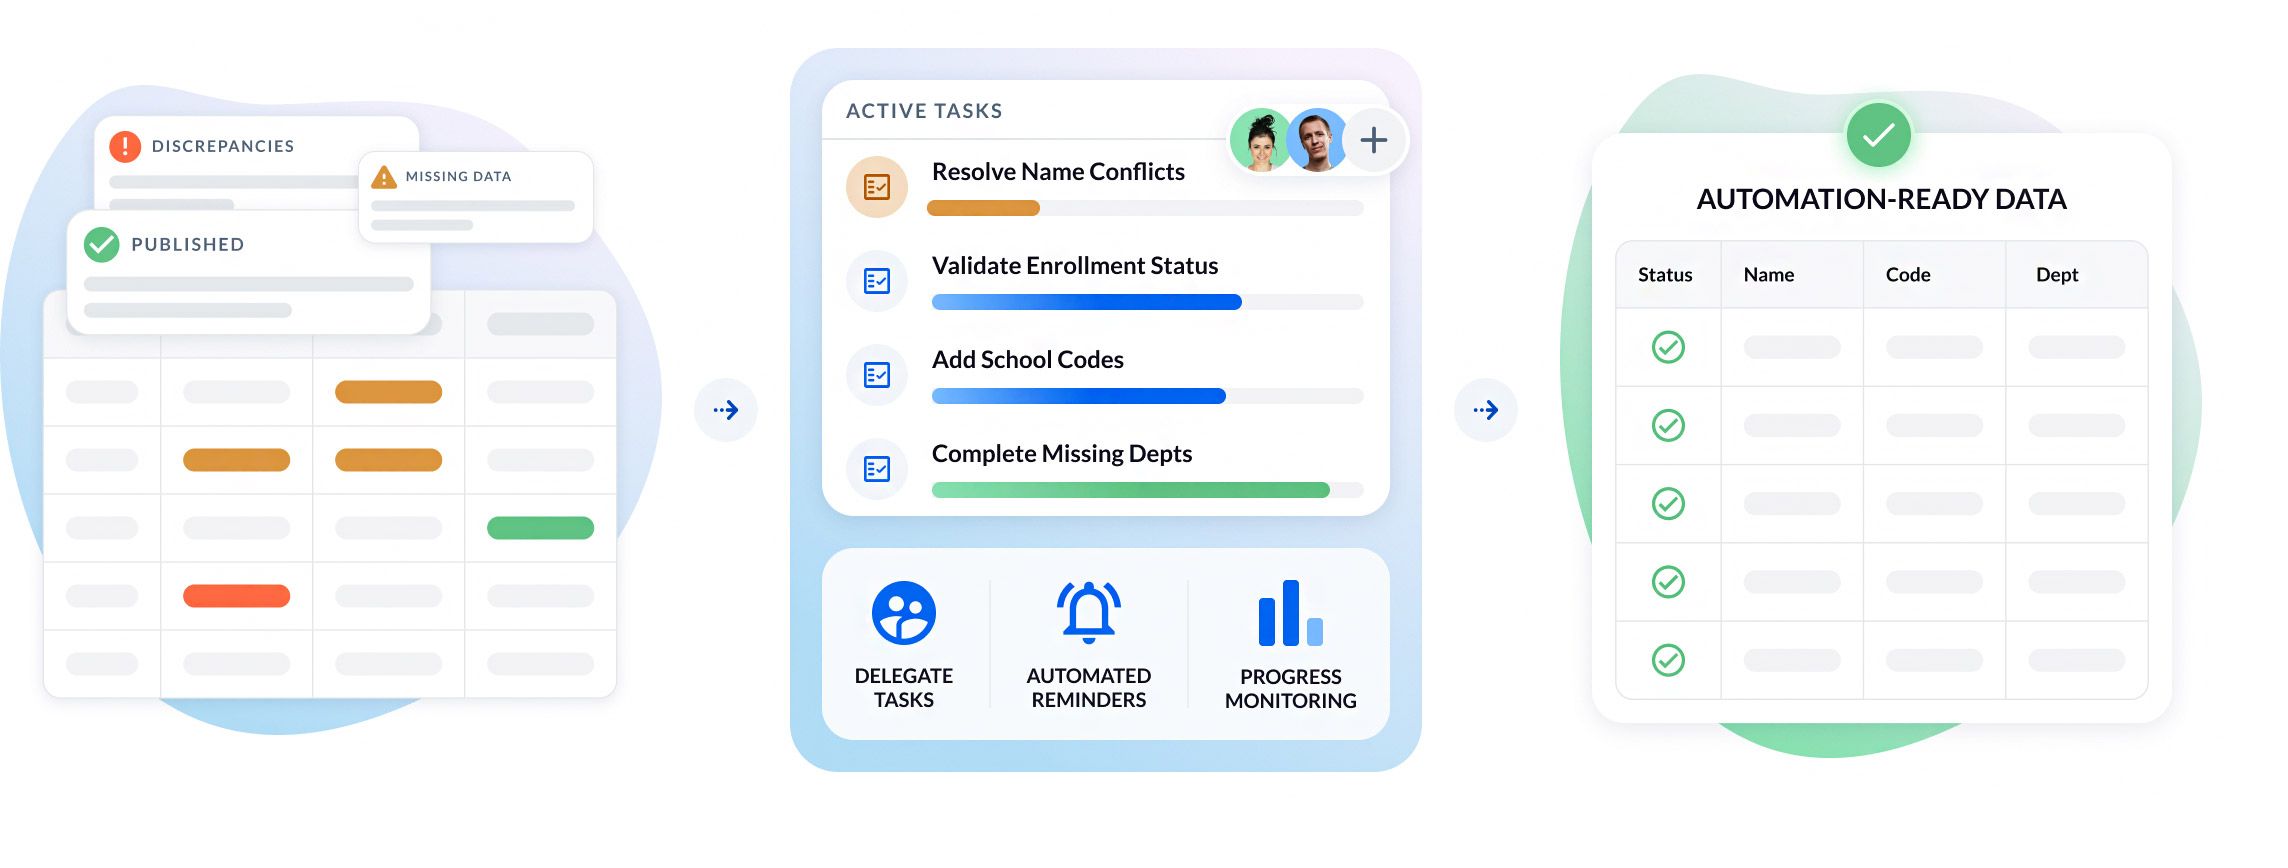
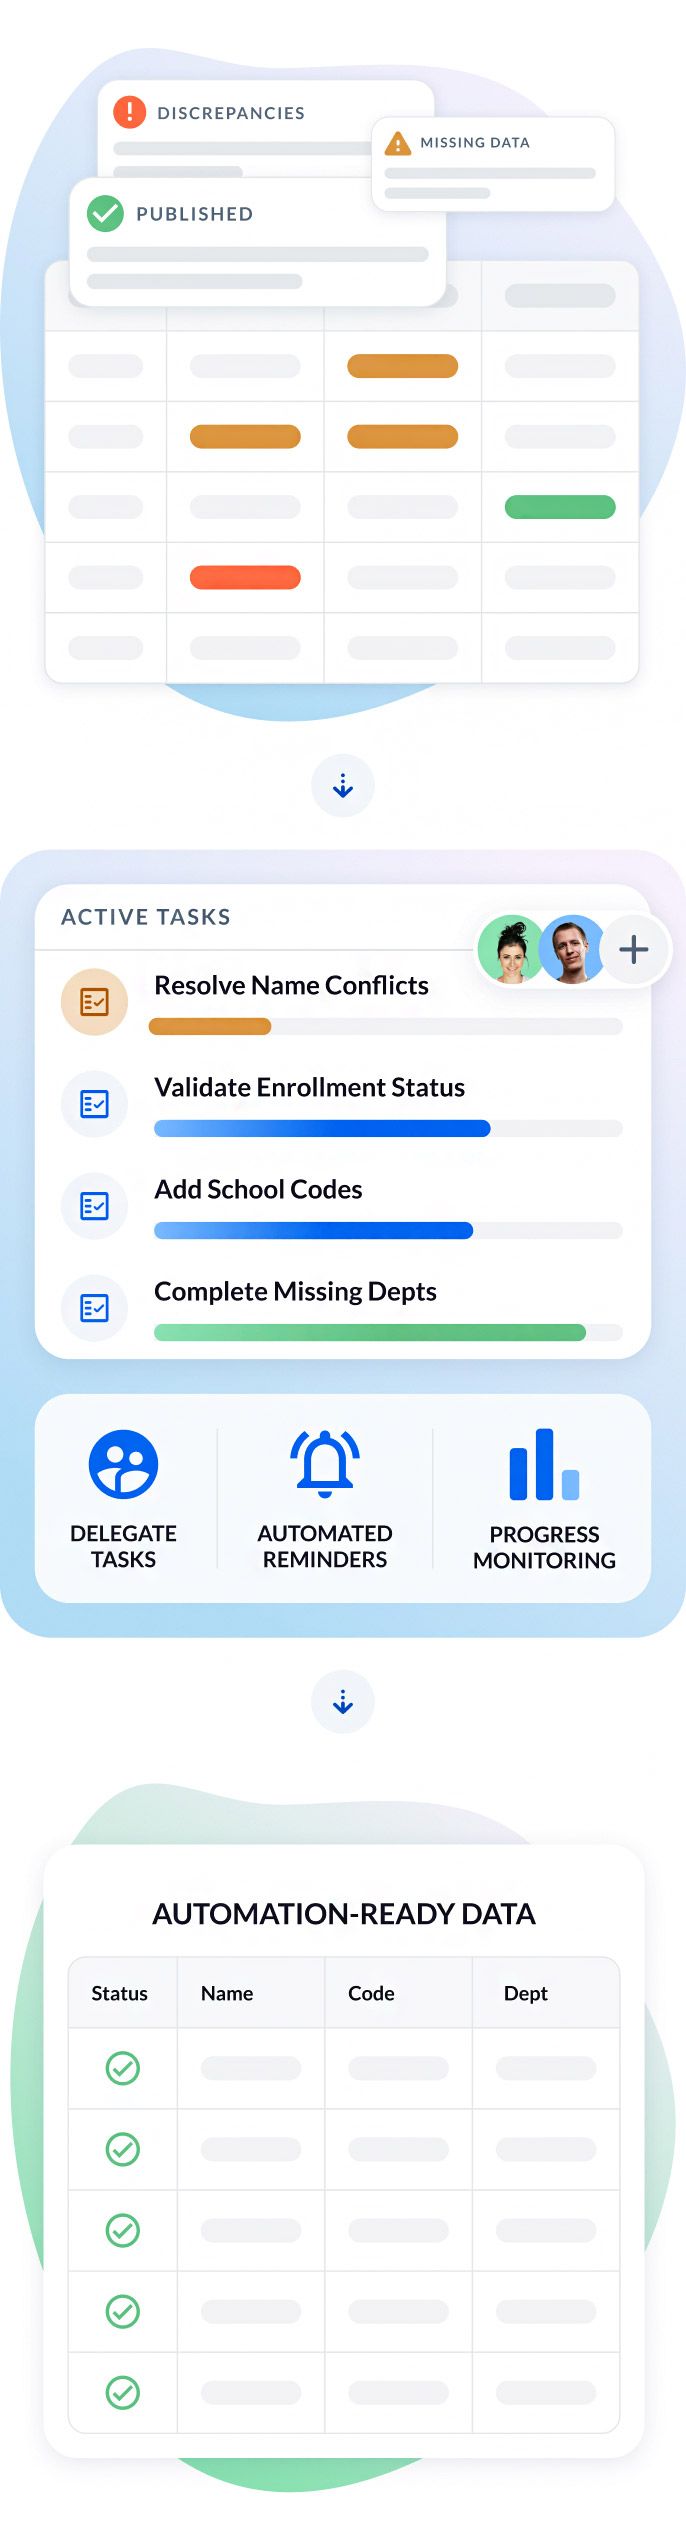
No matter your data quality, the Data Integrity Gateway (DIG) helps your team move from raw to automation-ready data. It supports enriching missing data, resolving discrepancies, and validating key records from a centralized, collaborative workspace. Delegate tasks to collaborators, with automated progress monitoring and reminders.
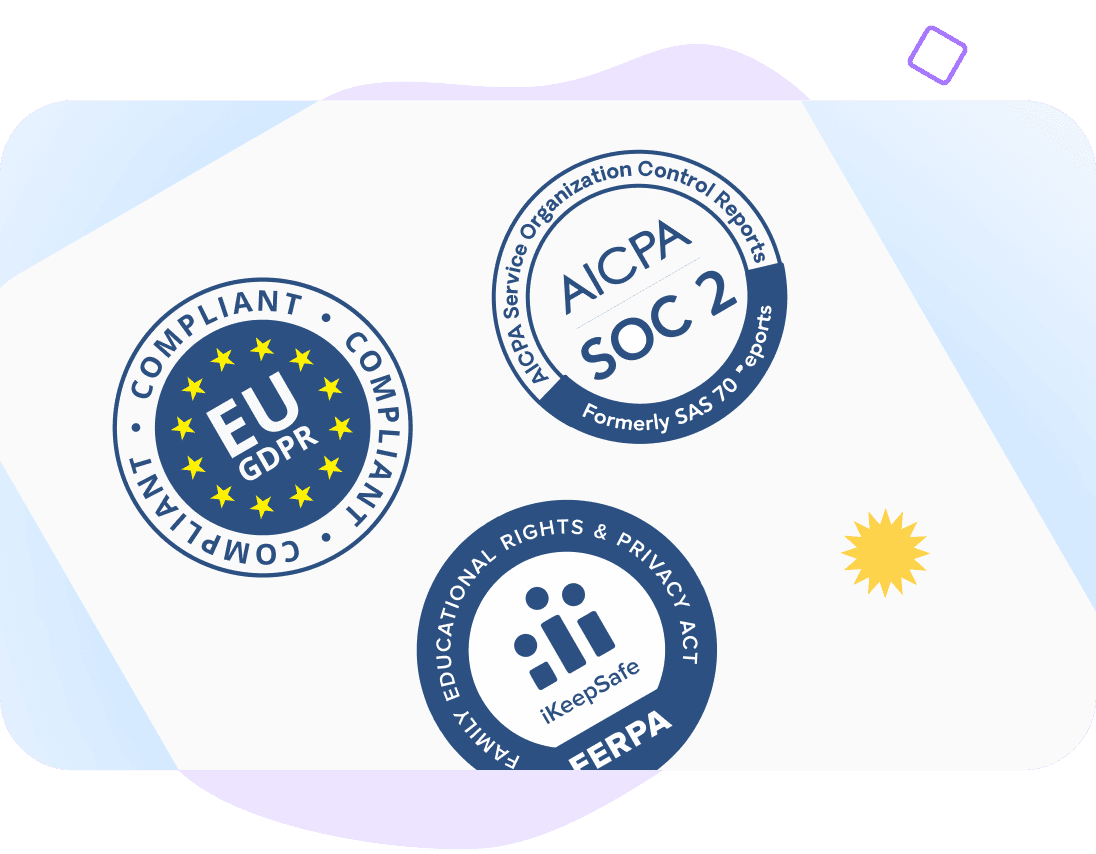
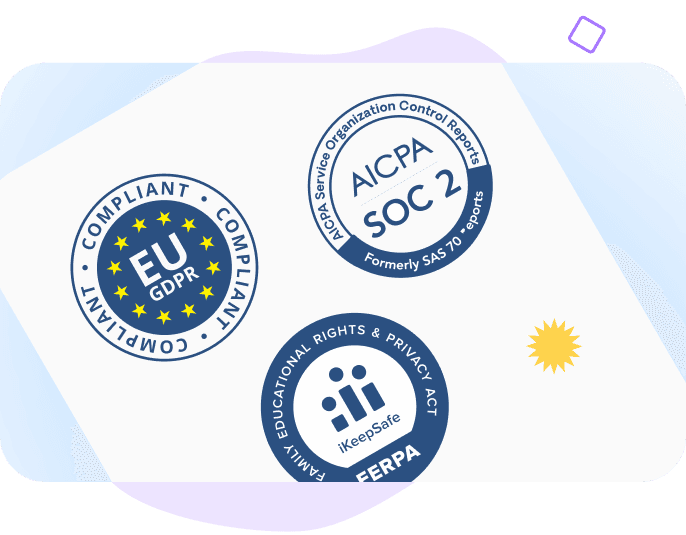
Explorance delivers top-tier data protection with GDPR, FERPA, and HIPAA compliance, end-to-end encryption, role-based access, and SOC2 Type 2 certification for proactive security management. Authentication can be secured through SSO and directory services.
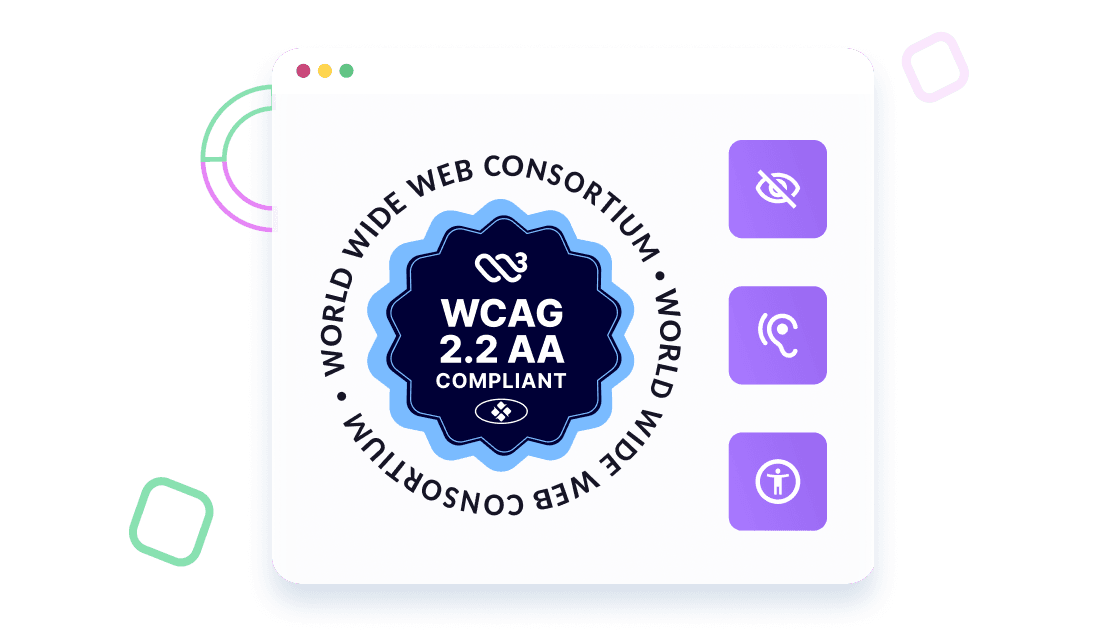
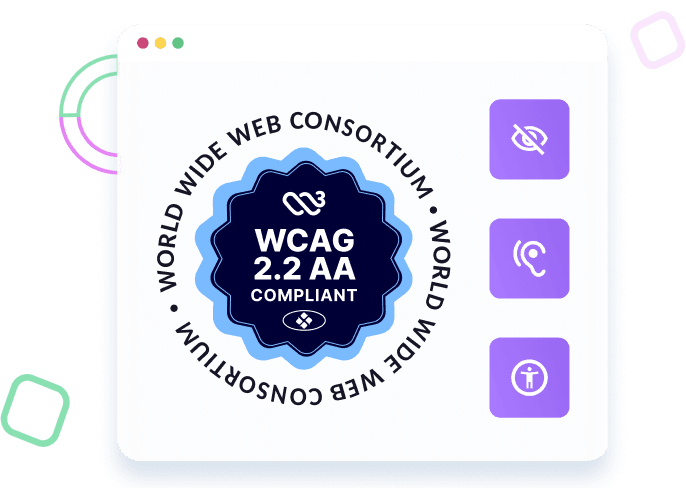
Explorance invests in meeting the highest accessibility standards for WCAG 2.2 (AA) and Section 508 to ensure students, faculty, and other stakeholders can fully participate in evaluations and access the resulting reports, regardless of disabilities and impairments.
Explorance's in-house Customer Success and Support teams partner closely with your assigned account managers to deliver proactive, empathetic, and solutions-driven assistance whenever you need it. At every step of the way, you have a global support team spanning multiple time zones always ready to help you achieve your institutional goals.
Any other questions?
Yes. Blue easily connects your student data with evaluation responses so you can break down results by attributes like residency status or GPA. This allows your institutional research team to instantly compare different student groups and identify unique trends or equity gaps across campus. To use this feature, the specific demographic information just needs to be included in your school's Blue data source.
Explorance Blue mirrors your unique organizational structure, no matter how complex or layered. Out of the box, the solution gives you flexible structural layouts to map your campus by neatly organizing academic divisions, colleges, and departments. If you have overlapping structures, such as a program that connects to both an academic dean and a regional campus location, you can run parallel reporting lines at the same time. This ensures that evaluations and insights flow directly to the right leaders, committees, and administrators automatically.
Explorance Blue automatically combines cross-listed courses into a single evaluation. When a student logs in, they will only see the exact course name and code they registered for, eliminating confusion. Once the feedback is collected, the results automatically flow into each participating department's reports while also generating a master report for the overall course.
Explorance Blue gives you the flexibility to evaluate team-taught courses exactly how your departments prefer. You can choose to split the results evenly among instructors, evaluate each teacher individually, or combine everything into a single shared report. To make the process more clear for students, you can feature a photo of each instructor right next to their specific evaluation questions so students know exactly who they are reviewing.
Explorance MLY has a model purpose-built for student experience analysis, using domain-specific themes and terminology sourced from actual student comments and annotated by humans. Because it’s powered by a proprietary machine learning (ML) model, analyzing the same comments will always yield the same results, unlike more general-purpose LLM-based solutions. Administrators can further refine taxonomies with institutional knowledge if they wish.
Explorance MLY can flag comments across alert topics such as discrimination, harassment, inappropriate language, threats, and suggestive or sexual language. Administrators can configure reports to include only comments with or without alerts, hide alert topics, or use redacted comment versions to remove sensitive or inappropriate content while preserving constructive feedback.
Explorance Blue centralizes evaluation results, while MLY automatically analyzes qualitative feedback and incorporates the insights into customizable Blue Reports. Together, they reduce manual analysis and help institutions organize evidence, identify trends, and align reporting with institutional accreditation goals.


'%3e%3cpath%20d='M5.83968%2010.4004L7.09855%2015.7752L1.29959%2021.5843L1.23852%2021.642C1.21137%2021.6692%201.18762%2021.6997%201.16047%2021.7235C0.481112%2022.4372%200.0747675%2023.3674%200.0127211%2024.3508C-0.0493254%2025.3343%200.236888%2026.3082%200.821155%2027.1016C0.885626%2027.1865%200.950095%2027.2713%201.01796%2027.3493C1.0306%2027.3649%201.0442%2027.3796%201.05868%2027.3935C1.16422%2027.5192%201.27755%2027.6382%201.398%2027.7497L1.4455%2027.7939L1.67624%2028.0246L9.14125%2035.4896L20.0334%2024.6043L5.83968%2010.4004Z'%20fill='white'/%3e%3cpath%20d='M13.1078%2039.4493L9.78247%2042.761L15.1539%2041.5055L20.98%2047.3113L21.0411%2047.369L21.1225%2047.4504C21.8375%2048.1288%2022.7681%2048.5345%2023.7517%2048.5965C24.7354%2048.6585%2025.7096%2048.373%2026.5041%2047.7897C26.5889%2047.7253%2026.6737%2047.6608%2026.7518%2047.5929L26.7959%2047.5522C26.9233%2047.4401%2027.0434%2047.3199%2027.1556%2047.1925C27.1709%2047.1795%2027.1845%2047.1647%2027.1963%2047.1484L27.4304%2046.9211L34.8954%2039.4561L23.9999%2028.5605L13.1078%2039.4493Z'%20fill='white'/%3e%3cpath%20d='M34.8921%209.76194L38.2072%206.45019L32.8358%207.70228L27.0199%201.89315L26.9588%201.83207C26.9317%201.80492%2026.9045%201.78117%2026.8808%201.75403C26.1658%201.07561%2025.2352%200.669967%2024.2515%200.607946C23.2679%200.545924%2022.2937%200.831473%2021.4992%201.41471L21.2515%201.61491L21.204%201.65902C21.0833%201.7643%2020.9699%201.87767%2020.8646%201.99833L20.8239%202.04245L20.5932%202.2664L13.1282%209.73141L23.9999%2020.6473L34.8921%209.76194Z'%20fill='white'/%3e%3cpath%20d='M47.1789%2022.1067C47.1181%2022.0204%2047.0524%2021.9377%2046.9821%2021.859L46.9414%2021.8149C46.8301%2021.6867%2046.7099%2021.5665%2046.5817%2021.4552L46.5376%2021.4145L46.3069%2021.1838L38.8419%2013.7188L27.9531%2024.6041L38.8419%2035.4928L42.157%2038.8046L40.9015%2033.4332L46.7073%2027.624L46.7683%2027.5663L46.8464%2027.4815C47.5267%2026.769%2047.9337%2025.8392%2047.9958%2024.856C48.0579%2023.8727%2047.771%2022.8992%2047.1857%2022.1067H47.1789Z'%20fill='%230050C1'/%3e%3c/g%3e%3cdefs%3e%3cclipPath%20id='clip0_6641_12689'%3e%3crect%20width='48'%20height='47.9966'%20fill='white'%20transform='translate(0%200.603516)'/%3e%3c/clipPath%3e%3c/defs%3e%3c/svg%3e)